
THIS is the One Thing to Watch in Stocks to Buy Right Now
Note: Post may contain affiliate links.
Learn how to find strong balance sheet stocks and the three stocks to watch with healthy cash flows.
Hey Bow Tie Nation, Joseph Hogue here with Let’s Talk Money and what could be the most important thing to watch in your stocks over the next few years.
All you out there in the Nation know, I love a stock with a strong balance sheet, that cash stability and financial flexibility. It’s one of the most overlooked strengths in stock picking and is going to be hugely important this year and next.
We're building a huge community on YouTube to beat your debt, make more money and start making money work for you. Click over to join us on the channel and start creating the financial future you deserve!
Join the Let's Talk Money community on YouTube!
How the Pandemic Brought Hard Times in the Stock Market
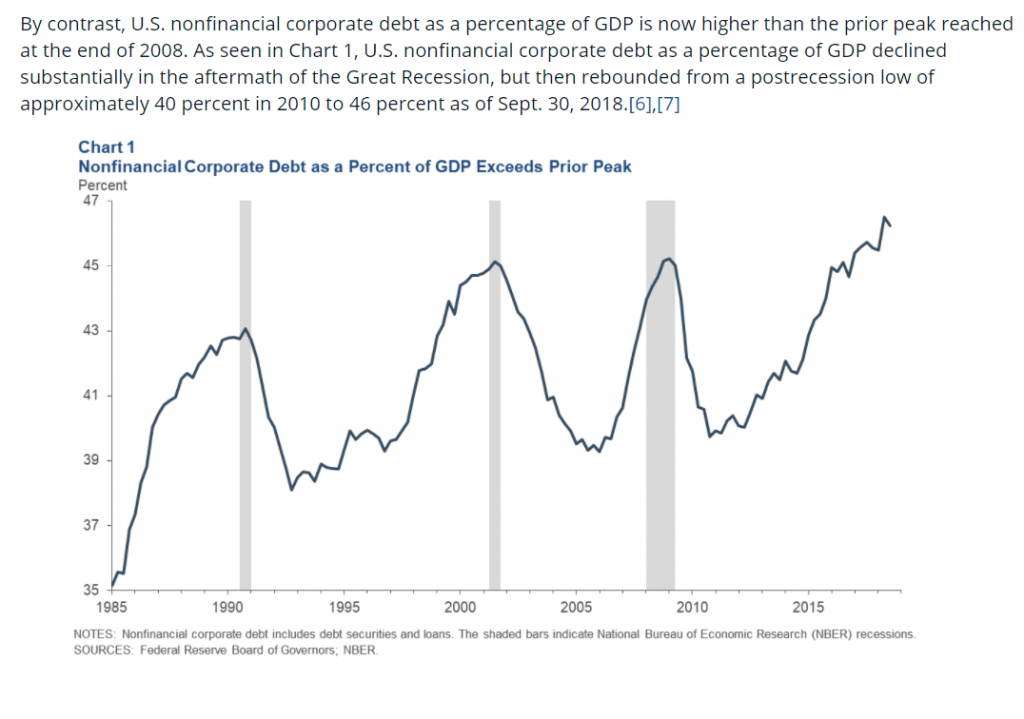
Cheap money and the pandemic have spawned a market monster with companies loading up on trillions in debt over the last year. Debt borrowed by companies has ballooned to over $11 trillion, that’s almost half the size of our entire economy and more than any time in history, even more than before the 2008 crash. A study by the Federal Reserve found that this kind of explosion in debt can amplify recessions.

A lot of companies borrowed tens of billions last year just to survive. Corporate America borrowed more than $1.7 trillion last year, 130% more than the previous record and total debt ballooned.
And it was even worse in the hardest-hit industries. Carnival Cruise Lines owed over $33 billion as of February, almost three times the debt it owed in 2019. Boeing doubled its debt in the pandemic to $64 billion!
And again, a lot of these companies had no choice but to borrow but it WILL have long-term effects on the stock price…Nation, the bill ALWAYS comes due!
We could be entering an era where high interest expense on that debt destroys earnings for certain stocks and the stock prices flatline for years. In this video, I’ll show you what to watch for in the balance sheet to avoid this trap. We’ll look at a simple stock screen that narrows our list of strong balance sheet stocks to buy then reveal the three stocks to watch with healthy cash flows.
I’ll be starting in the Featured Collections area of Stockcard.io, a great resource for finding groups of stocks around a theme and we’ll start with the Strong Balance Sheet collection of stocks, a list of 79 companies with solid financial positions then narrow our list from there. I’ll leave a link to stockcard in the video description below to check that out.
As a special bonus, I’ve negotiated an exclusive discount for everyone in the community. Use the promo code bowtienation for an exclusive discount beyond the free trial.
Sign up on Stockcard for free and make stock-picking easy with the research tool I use! Use promo code: bowtienation for an exclusive discount!
Strong Balance Sheet Stocks to Buy Right Now
First on our list of cash machine stocks is homebuilder DR Horton, ticker DHI, the largest U.S. builder at $33 billion market cap.
DHI builds almost 10% of the entire U.S. residential market and has well over that in some of its largest markets. Nearly one-in-five homes in the Dallas-Fort Worth area is built by DR Horton.
The company is fairly well diversified regionally with a little more exposure there in the South-east and South-central U.S. but that’s where the growth is right now so you would expect more activity in those regions.
And while the homebuilders have done really well over the last year, it could be the start of a ten-year bull run on the stocks. Homebuilding in the U.S. over the last two decades has created nearly 300,000 fewer homes per year than in the 30-years prior. That’s become a deficit of 5.5 million homes according to a study by the National Association of Realtors.
In fact, to get us back to where we have enough homes to meet demand, the U.S. would need to build more than 2.1 million units a year for over ten years. That’s more than were build each year during the boom ten years ago.
DHI has balance sheet cash of $2.1 billion versus $4.5 billion in debt and a debt-to-equity ratio of just 34%, a great financial position for a $30 billion company.
It’s producing $1.1 billion in free cash flow annually and over $5 billion in cash from operations, with an FCF growth rate of 59% over the last three years!
Earnings are expected higher by 64% this year to $10.50 per share which means the stock is trading for just 8.8-times on a price-to-earnings basis. Now the dividend yield of 0.9% isn’t much to get excited about but with the cash coming out of this company, I think that gets increased fast.
Analysts have an average target of $106 per share for a potential 15% return over the next year plus the dividend but the power here is in that long-term return as the industry makes up for that housing deficit.
We’ll get back to those other two stocks to watch but I want to show you how this screener is set up and then how to narrow our stock picks to a more manageable list. That initial balance sheet stocks list starts by filtering for companies over $300 million in market cap.
Now you know we love talking penny stocks here on the channel but they tend to get hit hardest in a recession and just have fewer financing options so if you’re looking for safer, more financially stable companies, you want to screen for a larger market cap.
It also filtered for companies with positive earnings and free cash flow over the last year. Free cash flow is the cash from operations left over after paying for growth spending to keep the business running so obviously when you’re talking a stable financial position, you want to see positive earnings and free cash flow.
The screener filtered for positive free cash flow and revenue growth over the last three years, just making sure that longer-term cash and sales growth is positive and not just the last year.
Finally, it screens for two debt measures here. A debt-to-equity ratio of less than 0.5 and a current ratio greater than 1.5-times.
The debt-to-equity ratio is how much debt a company owes versus how much of the assets are owned by equity investors. So if the company has $200 million in debt and only $100 million equity, then it would have a debt-to-equity of 2.0…which means creditors would own twice as much of the company as the investors.
So that’s another big one that investors are going to want to pay attention to over the next few years, how much of the company do investors actually own and how much is owed to creditors.
The current ratio is just the current assets of the company, so the assets that can be converted into cash quickly, and then divided by the current liabilities which are the debts the company needs to pay over the next year. It’s a great measure of how well the company can cover its short-term funding needs.
Next here is a timely stock pick, Medifast Inc, ticker MED, one of the largest wellness and weight loss companies at $3.4 billion market cap.
Medifast sells through two models, direct to consumer and a coaching model with over 52,000 wellness coaches. What I really like here, besides the demographic forces behind the trend, is that 90% of the company’s revenue is through that recurring monthly subscription-based plan.
Nation, let’s face it…the pandemic was not good for our waistlines. It was over a year of couch surfing and Oreos and more than 70% of the U.S. population is now overweight or obese with over 155 million Americans wanting to lose weight.
The company has over $212 million in cash and just $10 million in debt for a net cash positive balance sheet. It’s generating $174 million in free cash flow a year and has grown that by 45% annually over the last three years.
Earnings are expected 51% higher this year to $13.80 per share on 60% revenue growth. That means it’s a little more expensive at 20-times on that PE ratio but still relatively cheap compared to the market.
The average analyst target of $360 a share gets you to a 26% return over the next year plus the 2% dividend yield but this is another one with a long runway.
Now that initial screen of strong balance sheet stocks still left us with 79 stock picks so I want to filter this a little more so we don’t have quite so much to research. I’ll go into the screener on Stockcard and first select this good sales growth to filter for only companies with that above average revenue growth. I’m also going to toggle on for a positive earnings track record and let’s filter for dividend paying stocks as well.
Now that narrows our list of stocks to research to just six so maybe play around with the filters a little if you want a little larger list and more ideas.
Next here has the strongest cash flow of all, Newmont Corporation, ticker NEM, the world’s largest gold miner.
Through acquisitions and exploration, Newmont has built enough reserves to produce nearly eight million ounces of gold every year through 2030 and beyond. Management is forecasting up to seven million ounces of production a year through 2025 while reducing expenses to an all-in-sustainable cost of just $850 an ounce.
The price of gold is hovering around $1800 an ounce, at the low end of the recent range and is a great way to hedge inflation risks over the next few years. And this chart really says it all for the company. At just $1,200 an ounce, the company is able to sustain its dividend, pay down debt and invest for the future. With the price of gold forecast to rise, anything above that $1200 benchmark is going to be cash flow and dividend growth!
Newmont has balance sheet cash of $5.8 billion against $6.8 billion in debt and a debt-to-equity ratio of just 28%. It’s generating over $3.4 billion in free cash flow a year, an increase of 61% annually over the last three years.
Earnings are expected 31% higher to $3.50 a share over the next year for about an 18-time multiple on 15% sales growth to $13.2 billion.
The average analyst target of $72 a share is 14% above the current stock price plus that 3.5% dividend yield and future cash flow growth!
Sign up on Stockcard for free and make stock-picking easy with the research tool I use! Use promo code: bowtienation for an exclusive discount!
Leave a Reply
You must be logged in to post a comment.